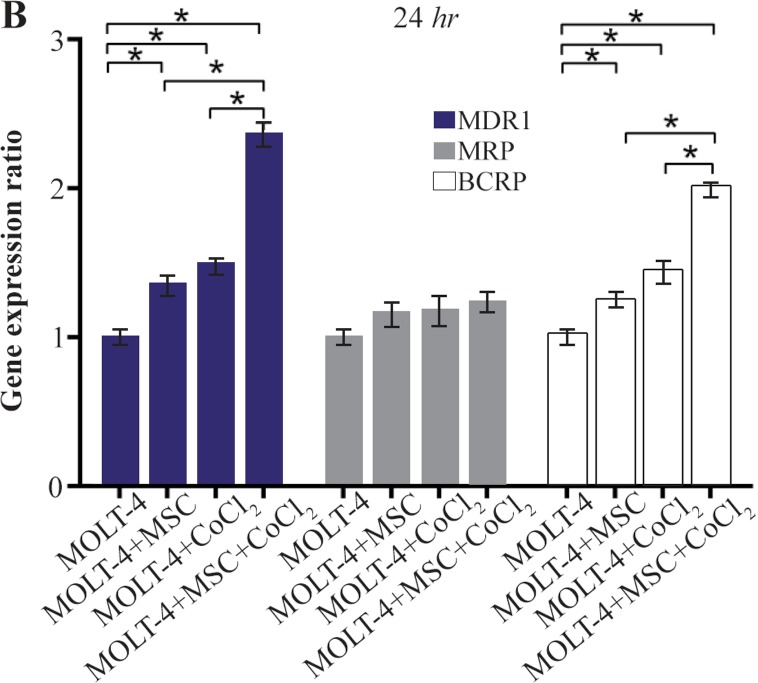
Figure 4B.
Real Time-PCR data for MOLT-4 cells MDR1, MRP, and BCRP genes expression under CoCl2 and hypoxia with and without MSC in different time courses. (B) MDR1, MRP and BCRP genes expression levels were analyzed by Real Time-PCR in MOLT-4 cells cocultured with MSC. RNA was extracted at 24 hr following 100 μM CoCl2 exposure. Data is presented as means±SD of three independent experiments. * Statistically significant difference compared to the respective data of control (untreated cells), p<0.05.

