Fig. 1.

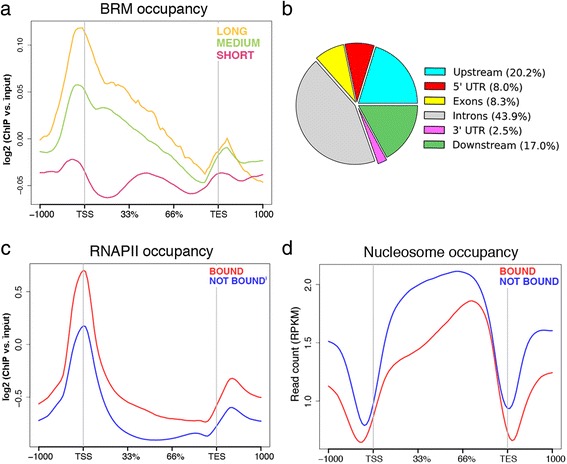
BRM occupancy in S2 cells analyzed by ChIP-seq with an antibody against the endogenous BRM. a The average distribution of BRM in genes classified according to gene length as indicated in the figure. n = 1357, 7763 and 4798 for long, medium and short genes, respectively. b The pie diagram shows the distribution of BRM peaks in the genome of S2 cells in relation to gene features. c Metagene analysis of RNAPII distribution in the BRM-bound (red, n = 2521) and not bound (blue, n = 11,403) genes. The plot is derived from data from Lam et al. [52]. The antibody used for the RNAPII ChIP-seq experiment was directed against Rpb3. d The average nucleosome density in the BRM-bound and not bound genes. The plot is derived from data from Shi et al. [25]
