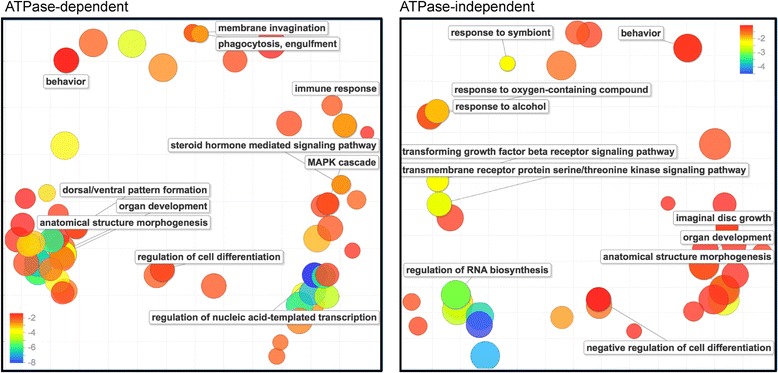
Fig. 4.

The biological functions of ATPase-dependent and ATPase-independent genes. Gene ontology enrichment tests were carried out for the ATPase-dependent and ATPase-independent genes using GOrilla. The scatterplots show gene ontology cluster representatives for the ATPase-dependent and ATPase-independent genes that showed decreased expression in response to BRM expression. The two-dimensional clustering was based on semantic similarity. Bubble color indicates the corrected probability value for the enrichment, in a log10 scale. Probability values were corrected for multiple testing. Bubble size indicates the frequency of the GO term in the underlying GO database (bubbles of more general terms are larger). The plots were generated by REVIGO based on the lists of enriched GO terms for genes that showed decreased expression in response to BRM expression. The genes upregulated by BRM expression did not show any significant enrichment
