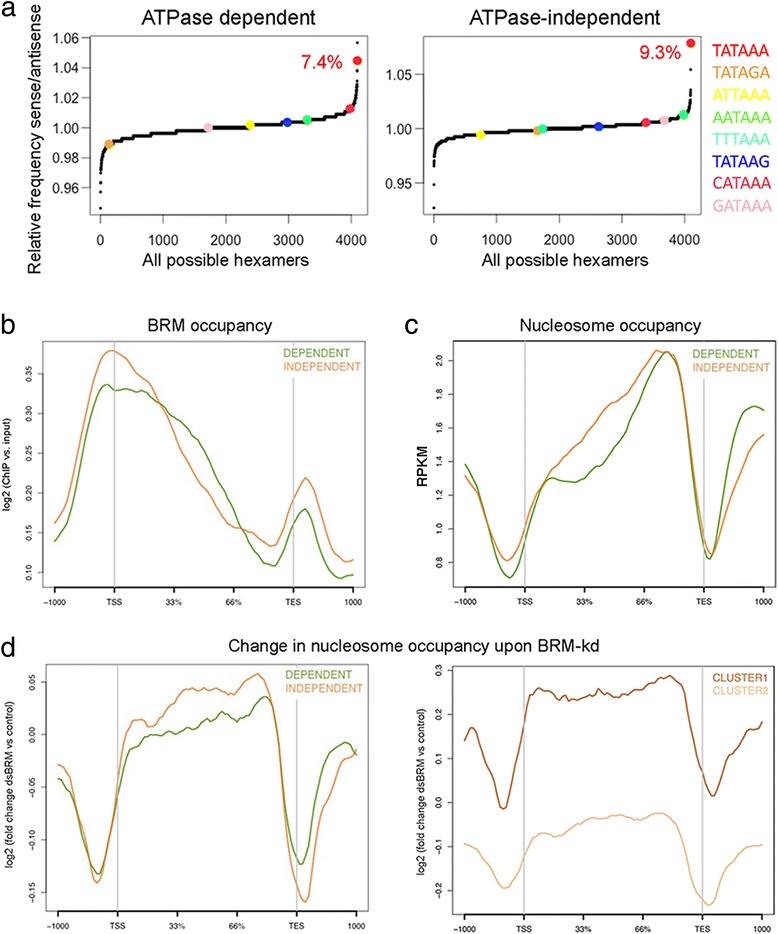
Fig. 5.

Characterization of the ATPase-dependent and ATPase-independent genes. a Analysis of TATA-box occurrence. The frequencies of all possible hexamers in the regions upstream (− 50/− 10 bp) of the TSS were calculated for BRM target genes. The plots show the log2 ratio of total occurrence number on the sense versus the antisense strand of the canonical TATAAA sequence and of alternative TATA box sequences in the two groups of genes. The red figures give the percentages of genes with the canonical TATAAA box. b-c Metagene analyses of BRM and nucleosome occupancy in the ATPase-dependent (green, n = 274 genes) and ATPase independent genes (brown, n = 267 genes). The distribution of BRM around the TSS is significantly different in the two groups (K-S test, p = 0.0001). The average nucleosome density in the gene body is significantly higher in the ATPase-independent genes (K-S test, p = 0.009). d Metagene analysis of changed nucleosome occupancy upon BRM depletion (K-S test, p = 0.002). The right panel shows the metagene of changed nucleosome occupancy for Clusters 1 (dark brown, n = 62 genes) and 2 (light brown, n = 205 genes), two groups of ATPase-independent genes defined by changes in nucleosome density upon BRM depletion. Cluster 1 shows a very high increase of nucleosome occupancy in cells depleted of BRM
