Fig. 2.

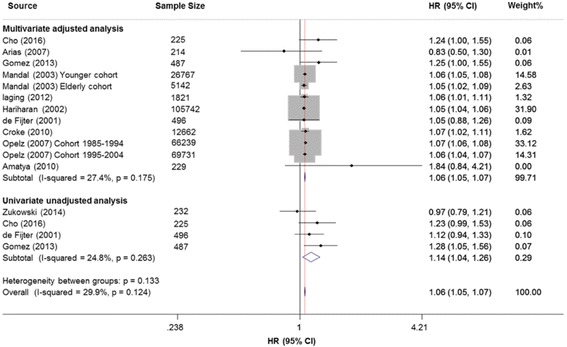
Forest plots of the association between HLA per mismatch and overall graft failure, using both of univariable-unadjusted and multivariable-adjusted effect estimates

Forest plots of the association between HLA per mismatch and overall graft failure, using both of univariable-unadjusted and multivariable-adjusted effect estimates