Fig. 2.

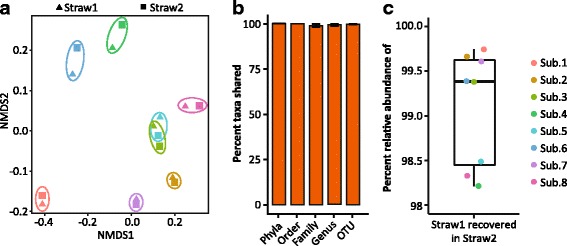
FAST subsamples capture reproducible communities. a Non-metric multidimensional scaling plots of the unweighted UniFrac metric between samples, colored by subject. Colored ellipses are the smallest area for human samples from each subject. b Taxa recovery in S2 compared to S1. Calculated with non-rarified data. Identified taxa were at least 0.1% relative abundance in at least one of the two samples in each comparison. c Percent relative abundance of S1 community captured in oral gavage preparation (S2). Where shown, bars represent mean ± standard error
