Fig. 3.

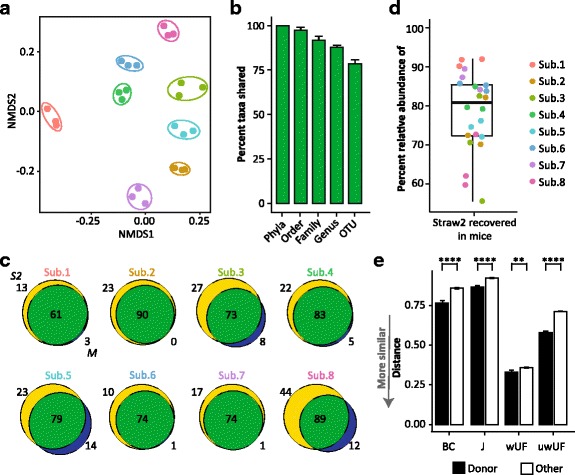
Transplanted communities capture human diversity and individuality. Germ-free B6 females were colonized with fecal slurries prepared from S2 and maintained on a chow diet for 2 weeks prior to fecal collection. a Non-metric multidimensional scaling plots of the unweighted UniFrac metric between mouse fecal samples, colored by donor. Colored ellipses are the smallest area for mouse-derived samples from each subject. b Taxa recovery in mouse fecal samples compared to oral inoculum (S2). Calculated with non-rarified data. Identified taxa were at least 0.1% relative abundance in at least one of the four samples in each comparison (S2 and 3 mouse fecal samples). c OTU Venn diagrams. Yellow circles represent OTUs in the oral inoculum (S2), blue circles represent OTUs recovered in the mouse (M), and green represents OTUs shared by both samples. d Percent relative abundance of the oral gavage community (S2) captured in mouse fecal samples. e Bray-Curtis (BC), Jaccard (J), weighted UniFrac (wUF), and unweighted UniFrac (uwUF) beta-diversity measures of mouse samples compared to their matched subject donor (DONOR) or compared to any non-donor subject (OTHER). ****P value < 0.0001
