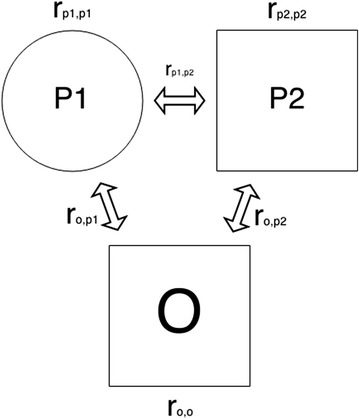
Fig. 1.

A trio of offspring (O), first parent (P1) and second parent (P2). The variables near the arrows indicate genetic relationships between individuals, while the variables over P1 and P2, and below O, are the individuals’ genetic relationships to themselves, respectively. Sexes are included in the figure but are not used by the GRL method
