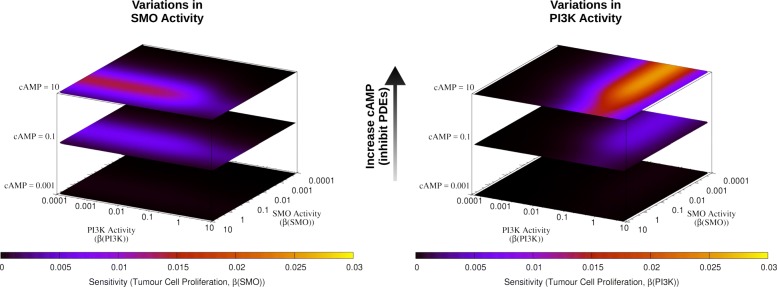
Fig. 2.
Sensitivity heat maps of the SMO network. Sensitivity was calculated in response to variations in SMO and PI3K activities on the xy-plane (left and right, respectively), combined with different levels of cAMP (as in Fig. 1) on the z-axis. The regions of high sensitivity between low and high SMO and PI3K activities (blue-red-yellow areas) correspond to a transition zone between low and high steady-state activity of tumour proliferation

