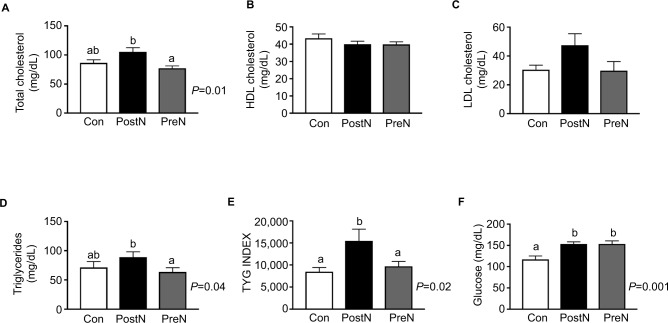
Figure 3.
Serum levels of total cholesterol (A), HDL cholesterol (B), LDL cholesterol (C), triglycerides (D), TyG index (E), and glucose (F) in Con, PreN, and PostN androgenized rats.
Notes: Con (n=8); PostN androgenized (n=7); PreN androgenized (n=8). (A) ANOVA P=0.01; (D) ANOVA P=0.04; (E) ANOVA P=0.02; (F) ANOVA P=0.001. Distinct letters indicate a statistical significant difference (adjusted P level <0.05) obtained with multi-comparison Tukey’s test.
Abbreviations: ANOVA, analysis of variance; Con, controls; HDL, high-density lipoprotein; LDL, low-density lipoprotein; PostN, postnatal; PreN, prenatal; TyG, triglygeride–glucose.

