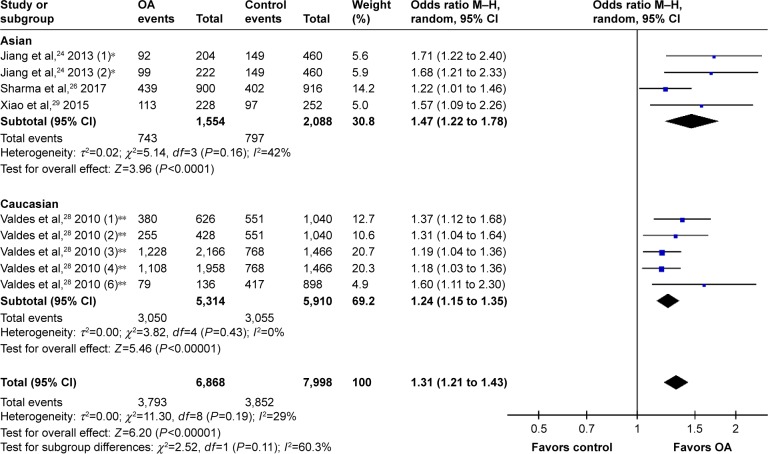
Figure 4.
Forest plot of rs12904199 in SMAD3 gene and risk of osteoarthritis using a random effect model: subgroup-analysis by ethnicity.
Notes: *This study comprised two cohorts: one with knee OA(1) and one with hand OA(2). **This study comprised eight cohorts: discovery sets performed in Nottingham (1) and (2); replication sets performed in Nottingham (3); replication set performed in Hertfordshire (5); replication set performed in Estonia (6); and replication sets performed in Chingford (7) and (8); not all cohorts are shown in this figure.
Abbreviations: M–H, Mantel–Haenszel; OA, osteoarthritis; OR, odds ratio.

