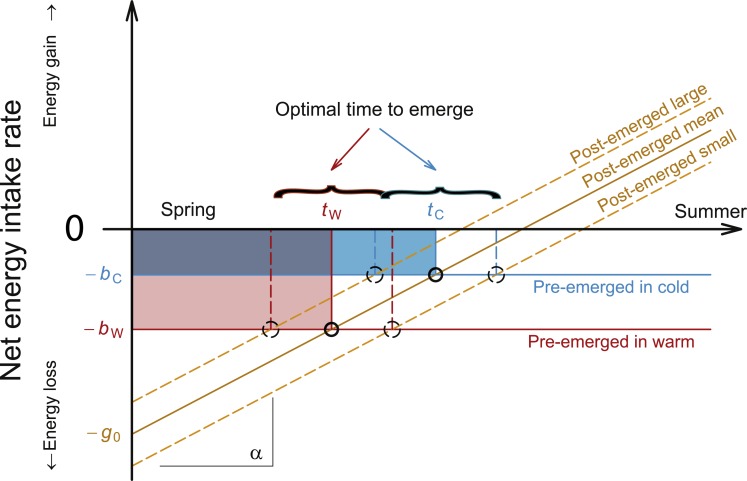
Figure 4. Schematic presentation of mechanistic model predicting the optimum emergence date for bee individuals with different body condition and under different overwintering temperatures.
–bc: net energy intake rate for inactive (pre-emerged) bee in cold overwintering temperature. –bw: net energy intake rate for an inactive (pre-emerged) bee in warm overwintering temperature. –g0: net energy gain for an active (post-emerged) bee from natural resources. α: (daily) increase in net energy intake rate for an active (post-emerged) bee in spring. tw: optimal time to emerge for a bee in warm overwintering temperatures. tc: optimal time to emerge for a bee in cold overwintering temperatures. The red area represents the cumulative (integrated) weight loss for bees under warm and the blue area represents the cumulative weight loss for bees under cold overwintering temperatures. As long as −g0 is not close to –bw (very short winter) the red area will be larger than the blue, indicating higher energy consumption of bees during warmer but briefer overwintering periods than of bees overwintering under cold conditions. In Appendix 2 we provide a more formalized and precise version of this argument.

