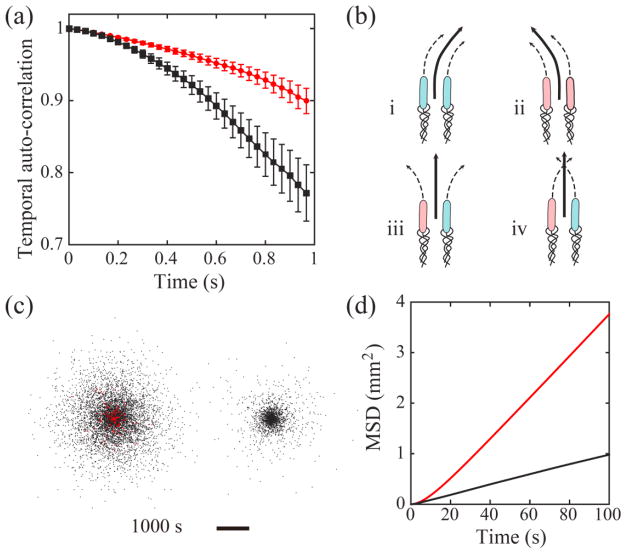
Figure 4.
(a) Auto-correlation of cells’ velocity direction measured in experiments. Red circles correspond to cells moving as cohesive pairs (n=126 cells), and black circles correspond to individually moving cells (n=96 cells). Bars represent standard error of the mean. (b) Illustration of 4 possible scenarios of cell-wall interaction for a pair of cells undergoing cohesive swimming. Cells colored in pink (or blue) interact with the upper (or lower) wall and tend to curve to the left (or to the right). The two cells in scenarios (iii) and (iv) interact with opposite walls, so the pair has reduced directional bias. (c) Spatial distribution of modeled cells with (Left) and without (Right) cohesive swimming at the end of a typical simulation run. Red dots represent cells undergoing cohesive swimming and black dots represent cells moving individually. The duration of simulation corresponds to cell dispersal for 1000 s. Scale bar, 5 mm. See Supplementary Movie 6 [42]. (d) Mean square displacement (MSD) of cells in simulations. All modeled cells outside the “virtual inoculum” (see definition in main text) were included in the calculation. Red and black lines plot the average MSD (n= 5 independent simulation runs) for cells with and without cohesive swimming, respectively.

