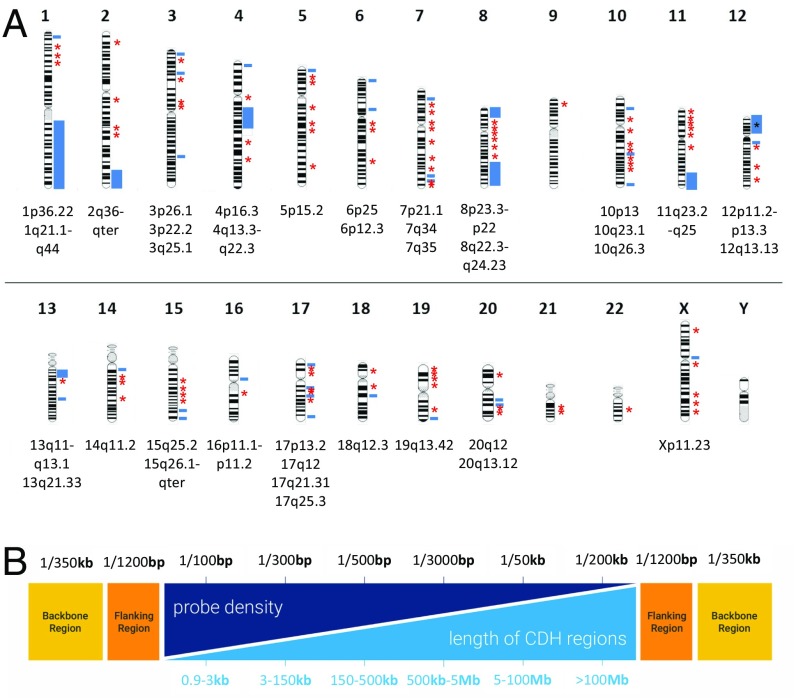
Fig. 1.
Customized array targeted for CDH candidate regions. (A) Map of genes and genomic regions covered by custom array. Blue bars indicate known and candidate genomic regions implicated in human CDH. Red asterisks indicate other CDH candidate genes. (B) The light blue section shows different lengths of the targeted CDH regions, and the dark blue section represents different probe densities designed for the targeted regions. The orange bars represent regions flanking CDH targets, and the yellow bars represent the backbone for the rest of the human genome.

