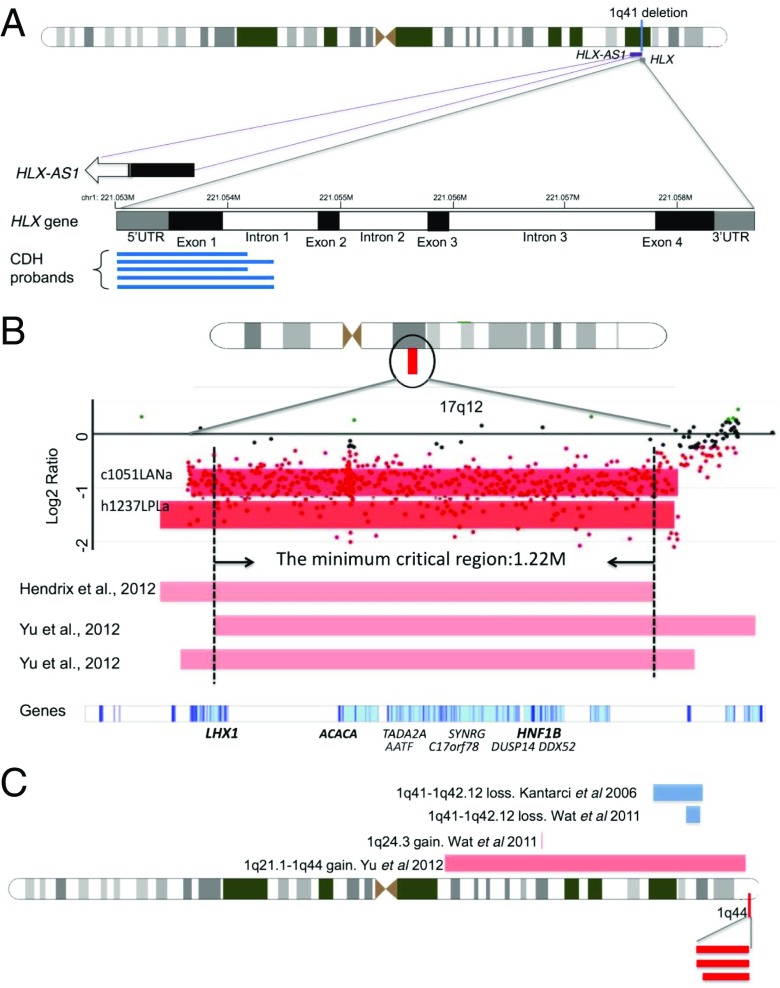
Fig. 2.
Depiction of significant CNV regions. For CNVs, red bars represent loss and blue bars represent gain. (A) The 1q41 CNVs involving the HLX gene. Black boxes represent exons, white boxes are introns, and gray boxes are the untranslated regions. The numbers on the top of the genes indicate chromosomal coordinates (hg19/GRCH37). Blue lines indicate the relative positions of the duplications in our five patients with CDH. The 3′ end of the noncoding RNA gene, HLX-AS1, overlaps with the 1q41 duplication as shown. The open arrow indicates the 5′ of this gene is beyond the range of this figure. (B) The 17q12 deletions from two patients (dark red bars) in our study as well as three patients (light red bars) from previous studies (21, 30). The x axis indicates the genomic location, and the y axis indicates the log2 ratio from the array. The dots indicate probe intensities in this region of the array. LHX1, ACACA, and HNF1B (in bold) are candidate CDH genes in this CNV. (C) The 1q44 deletions from three patients (dark red bars) in our study. Four published cases of deletions (blue bars) and duplications (light red bars) in the neighboring region are also indicated.

