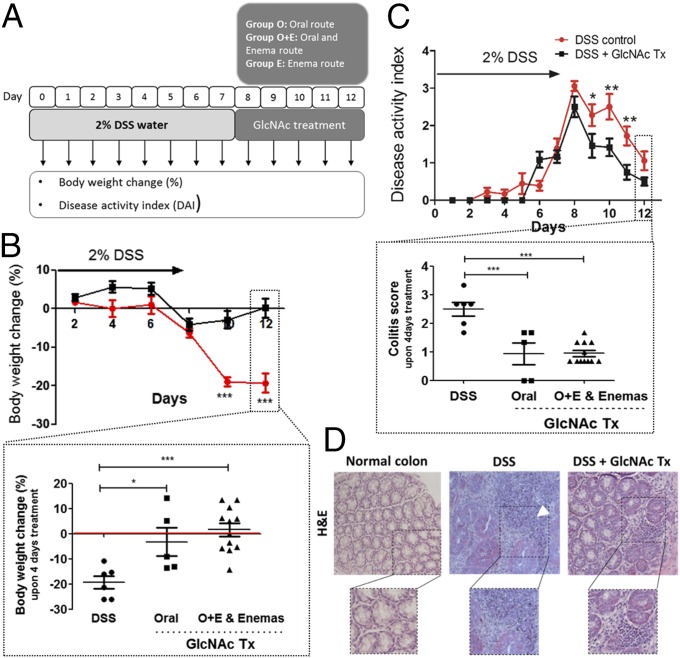
Fig. 4.
Colitis-induced mouse model treated with GlcNAc displays significant control of disease severity and recovery from clinical signs. (A) Schematic representation of the in vivo study performed on C57BL/6 mice. (B and C) Body weight changes and DAI. (B) Effects of GlcNAc on body weight change (%) comparing DSS control and GlcNAc-treated animals. Graphs depict the mean ± SEM. Two-way ANOVA with Bonferroni postcorrection: ***P ≤ 0.001. (Inset) Discrimination of the effects of GlcNAc on body weight change (%) using different routes of administration. Scatter plots include the mean ± SEM. One-way ANOVA with Bonferroni postcorrection: *P ≤ 0.05; ***P ≤ 0.001. (C) DAI comparing mice with colitis that were untreated with those that were treated with GlcNAc. Plots depict the mean ± SEM. Two-way ANOVA with Bonferroni postcorrection: *P ≤ 0.05; **P ≤ 0.01. (Inset) Discrimination of the effect of GlcNAc on colitis scores using different routes of administration. Plots depict the mean ± SEM. One-way ANOVA with Bonferroni post correction: ***P ≤ 0.001. (D) Representative histological images (H&E) of colonic samples from mice [normal colon, DSS (DSS-induced colitis), and GlcNAc treatment (Tx) (DSS + GlcNAc Enema Tx)]. (Magnification: 40×.)

