Fig. 1.
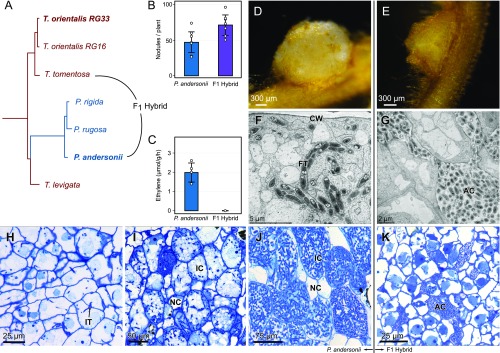
Nodulation phenotype of P. andersonii and interspecific P. andersonii × T. tomentosa F1 hybrid plants. (A) Phylogenetic reconstruction based on whole chloroplast of Parasponia and Trema. The Parasponia lineage (blue) is embedded in the Trema genus (red). Species selected for interspecific crosses are indicated and species used for reference genome assembly are in bold. All nodes had a posterior probability of 1. (B) Mean number of nodules on roots of P. andersonii and F1 hybrid plants (n = 7). (C) Mean nitrogenase activity in acetylene reductase assay of P. andersonii and F1 hybrid nodules (n = 4). Bar-plot error bars indicate SDs; dots represent individual measurements. (D) P. andersonii nodule. (E) F1 hybrid nodule. (F and G) Ultrastructure of nodule tissue of P. andersoni (F) and F1 hybrid (G). Note the intracellular fixation thread (FT) in the cell of P. andersonii in comparison with the extracellular, apoplastic colonies of rhizobia (AC) in the F1 hybrid nodule. (H–J) Light-microscopy images of P. andersonii nodules in three subsequent developmental stages. (H) Stage 1: initial infection threads (IT) enter the host cells. (I) Stage 2: progression of rhizobium infection in nodule host cell. (J) Stage 3: nodule cells completely filled with fixation threads. Note difference in size between the infected (IC) and noninfected cells (NC). (K) Light-microscopy image of F1 hybrid nodule cells. Note rhizobium colonies in apoplast, surrounding the host cells (AC). Nodules have been analyzed 6 wk post inoculation with M. plurifarium BOR2. CW, cell wall.

