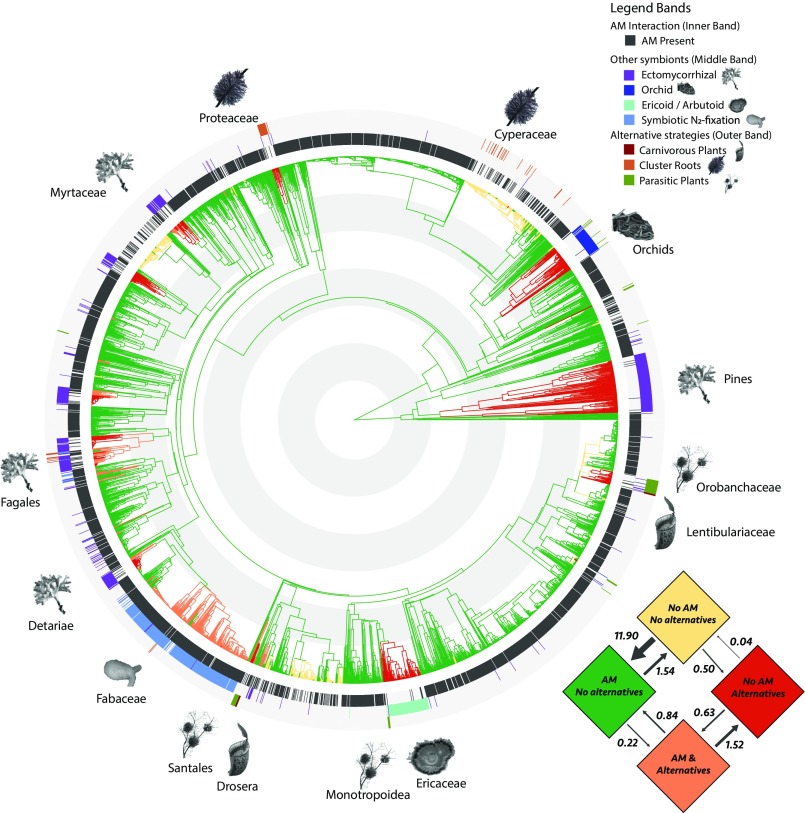
Fig. 2.
Transition rates and ancestral state reconstruction of the dependent evolutionary model for plant AM status and AM alternatives. The four potential evolutionary states are represented by colors in the transition matrix and on the seed plant phylogeny. Transition rates are expressed as number of transitions per 100 My per lineage. The ancestral state is AM presence with no AM alternatives (green), and red indicates the switch to one of the AM alternatives (i.e., another mycorrhizal fungus, symbiotic N2 fixation, parasitism, carnivory, or cluster roots). From inside to outside, colored bands around the phylogeny indicate the presence or absence of (i) AM interactions, (ii) other root symbionts, and (iii) alternative resource acquisition strategies. Key clades that have lost AM fungal interactions are indicated with schematic images of their evolved alternatives. Gray and white concentric circles indicate 50 My. An expanded version with fully legible species labels for all 3,736 species is available online (SI Appendix). Images courtesy of (Ectomycorrhizal) Wikimedia Commons/B. Zak; (Orchid) adapted with permission from ref. 70; (Ericoid/Arbutoid) adapted with permission from David Midgley (photographer); (Symbiotic N2-fixation) Euan James (The James Hutton Institute, Dundee, Scotland); (Carnivorous Plants) Pixabay/PublicDomainPictures; (Cluster Roots) adapted with permission from ref. 69.; and (Parasitic Plants) Pixabay/Egle_pe.

