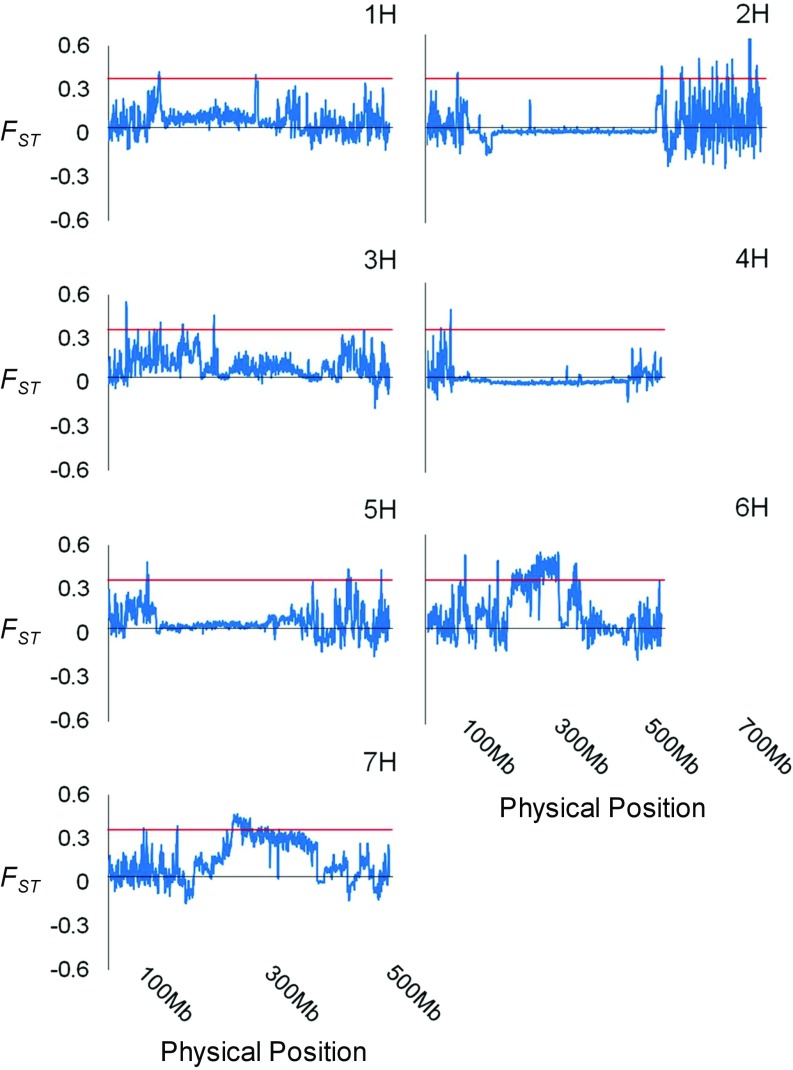
Fig. 3.
Distribution of windowed FST values along each chromosome between wild barley populations from the Terra Rossa and basalt soils at the Tabigha Evolution Slope. The x axis indicates the physical position, and the y axis shows the value of FST for each 1-Mb genomic region with steps of 250 kb. The red solid lines indicate the threshold FST value (0.3) delimiting regions considered to be under strong selective sweeps.

