Fig. 3.
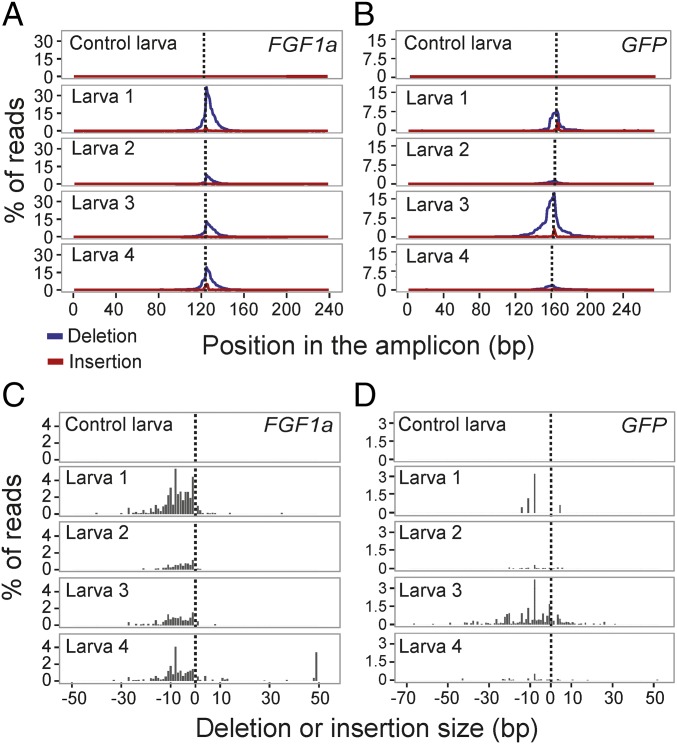
Mutational spectra in CRISPR/Cas9-injected animals as determined by MiSeq amplicon sequencing. For each gene, one control larva (only Cas9 protein injected) and the four sgRNA/Cas9-injected larvae determined by MiSeq sequencing to contain mutations (Fig. 2B, column 3) were analyzed further. (A and B) The percentages of reads with a deleted (blue lines) or inserted (red lines) base at each nucleotide position. Dotted lines, expected Cas9 cut sites. Note that for GFP, the method of analysis used here does not resolve the paralogous copies of the gene (SI Appendix, SI Materials and Methods). (C and D) The percentages of reads with deletions (Left of dotted line) or insertions (Right of dotted line) of various sizes in the same larvae as shown in A and B.

