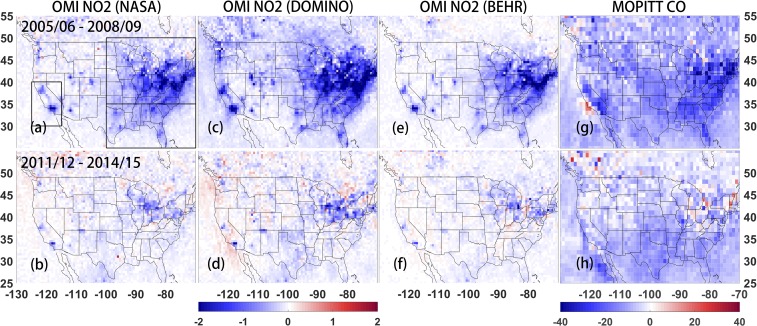
Fig. 3.
(A–F) Difference of mean tropospheric OMI NO2 columns from 2005–2006 to 2008–2009, and from 2011–2012 to 2014–2015. The unit is 1015 mole/cm2. (G and H) same as A–F, but for MOPITT surface layer CO measurements with unit ppb (parts per billion). A also indicates the southwest, southeast, and northeast US regions for sampling satellite observations at the AQS sites used in Fig. 5 comparison.

