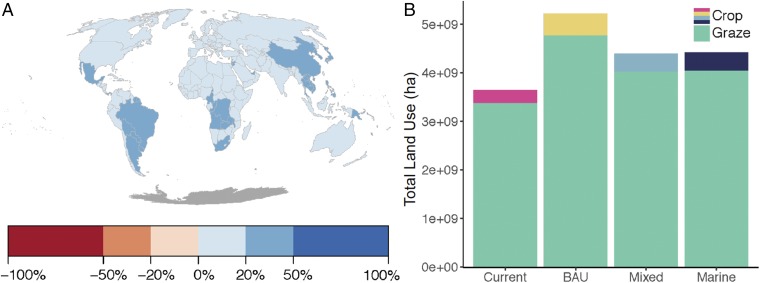
Fig. 4.
Amount and location of changes in total land use under different 2050 animal production scenarios. (A) Percent of land spared (blues) or used (reds) accounting for grazing and crop demands based on a comparison of business-as-usual (BAU) 2050 meat-based diet to seafood diet scenarios, sourced from mixed (freshwater and marine) aquaculture. Marine results are equivalent to the mixed scenario outputs and thus not depicted. (B) Total average land use from crops (rainbow colors) and grazing (green color) for feed of each scenario. SDs of cropland use were too small at the grazing scale and are thus not presented (see Fig. 3 for SD). Countries in gray do not change or are not applicable.

