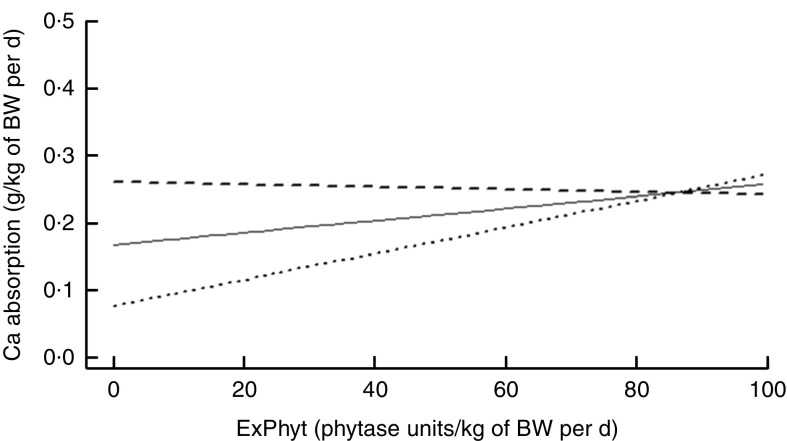
Fig. 2.
Change in calcium absorption with increasing exogenous phytase intake (ExPhyt) at
three different levels of total calcium intake (TCa), to illustrate the interaction
between TCa and ExPhyt identified in the final linear mixed effects regression model
for calcium absorption. At higher TCa ( : TCa set to its
mean+sd from the data set), calcium absorption remains relatively
unchanged with increasing ExPhyt. At lower TCa (
 : TCa set to its mean
value from the data set;
  : TCa set to its mean−sd from the
data set), calcium absorption increases with increasing ExPhyt. The remaining
variables (non-phytate-P intake and phytate-P intake) were fixed and set to their
mean values from the data set. BW, body weight.

