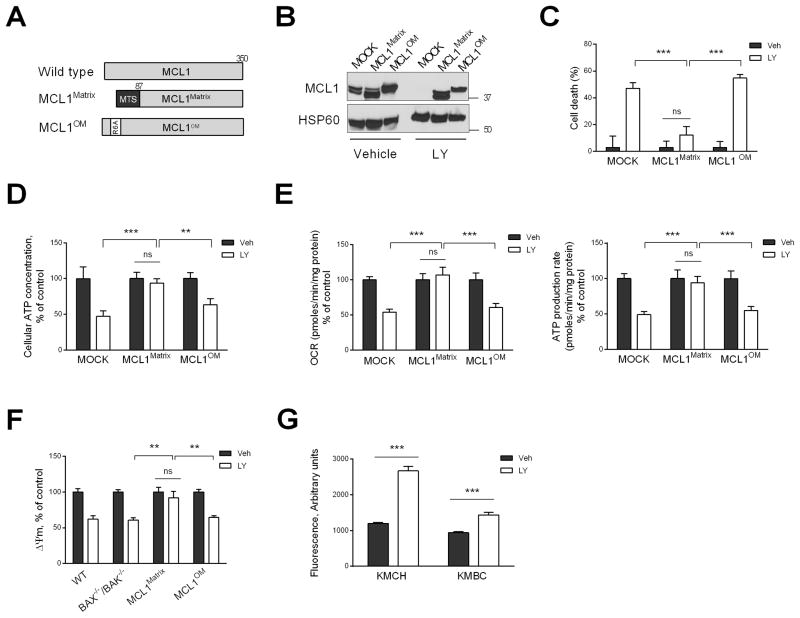
Fig. 4. Loss of matrix MCL1 induces cell death by causing failure of mitochondrial oxidative metabolism.
(A) Schematic illustration of matrix and outer membrane (OM) MCL1 mutants. N. crassa ATP-synthase mitochondrial targeting sequence (MTS) is indicated in black. Point mutation (R6A) is indicated in white. MCL1 mutants were stably expressed in KMCH cells and used for experiments in B–F. (B) KMCH cells expressing MCL1 mutants were treated with vehicle or LY2874455 (LY, 5 μM) for 24 h. Lysates of isolated mitochondria were subjected to immunoblot analysis of MCL1. (C) Cell death rate of KMCH cells expressing MCL1 mutants treated with vehicle or LY (5 μM) for 24 h was assessed by SRB assay. (D) KMCH cells expressing MCL1 mutants were treated with vehicle or LY (5 μM) for 6 h, and cellular ATP levels were measured. (E) KMCH cells expressing MCL1 mutants were treated with vehicle or LY (5 μM) for 6 h, and oxygen consumption rate (OCR) and ATP production rate were measured using the Seahorse XF24 extracellular flux analyzer. (F) WT, BAX−/−/BAK−/−, and MCL1 mutant cells were treated with vehicle or LY (5 μM) for 6 h, and mitochondrial membrane potential (Δψm) was evaluated by TMRM (100 nM) staining. (G) Cells were treated with vehicle or LY (5 μM) for 6 hours. Reactive oxygen species (ROS) levels were assessed by dihydroethidium fluorescence intensity using Celigo Imaging Cytometer. Bar graphs represent mean ± SEM for at least three independent experiments. ns, non-significant. ***p < 0.001, **p < 0.01. Statistical significance was determined using the two-tailed t test or one-way ANOVA followed by Dunnett’s test.

