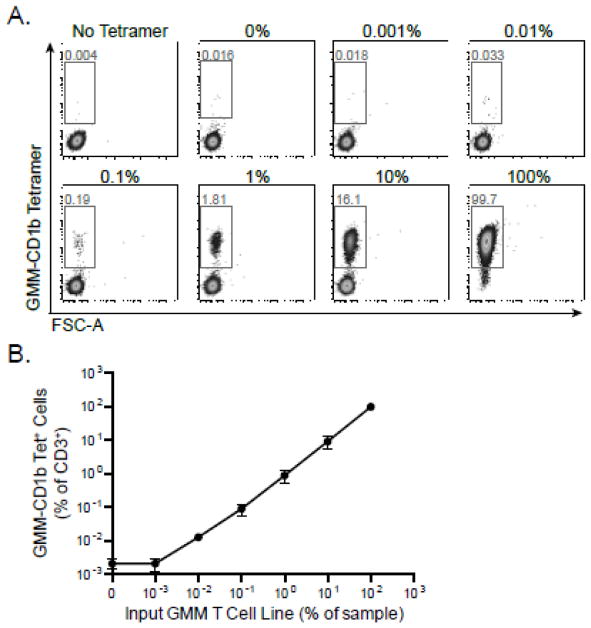
Figure 5. Evaluating the linearity and range of the CD1 Tetramer Assay.
GMM-specific T cells were serially diluted with PBMC from a healthy donor, and samples ranged from 100% to 0% GMM-specific T cells. The cells were stained with GMM-CD1b tetramer, and the frequency of GMM-specific T cells was measured. (A) Representative data in which the fraction of CD3+ T cells that stain with the tetramer over 10-fold dilutions of the GMM-specific T cell line. (B) Summary analysis of three independent experiments. Shown are the mean and standard error of the mean at each dilution. GMM tetramer staining is linear down to a precursor frequency of 0.001% input GMM-specific T cells.

