
Fig. 10.
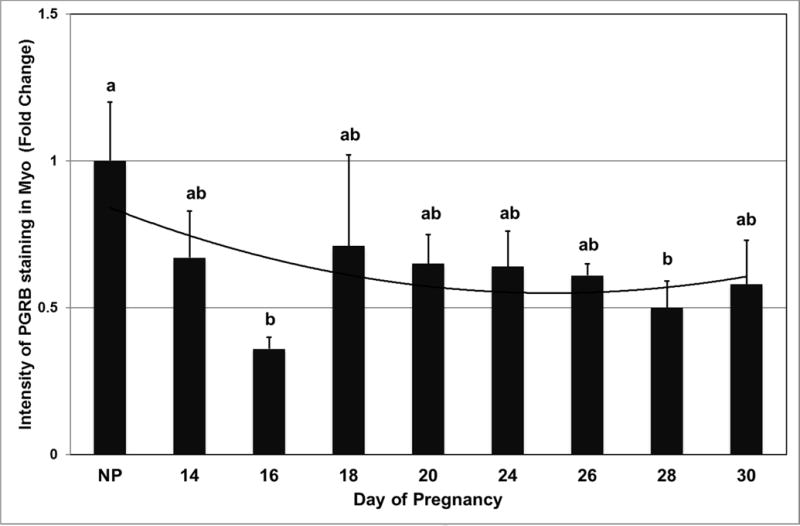
Expression of PGRB protein in Myo as determined by immunofluorescence and image analysis based on staining intensity. Data are expressed as fold change compared with NP control arbitrarily set as 1. a,bP<0.05; values ± SEM with different superscripts are significantly different.