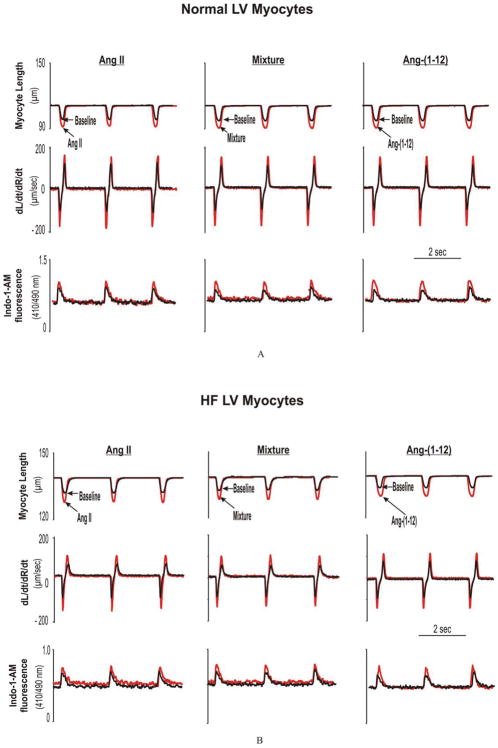
Figure 1.
Examples of LV myocyte functional responses to angiotensin peptides in normal (A) and HF (B). Fig 1A. Representative of superimposed traces of analog recordings from freshly-isolated LV myocytes obtained from one normal rat at baselines and after superfusion of Ang II, Mixture, and Ang-(1-12), respectively. Shown are myocyte percent of shortening (SA), peak velocity of shortening (dL/dtmax) and relengthening (dR/dtmax), and the peak [Ca2+]iT. Fig 1B. Representative of superimposed traces of analog recordings from freshly isolated LV myocytes obtained from one ISO-induced HF rat at baselines and after superfusion of Ang II, Mixture and Ang-(1-12), respectively.

