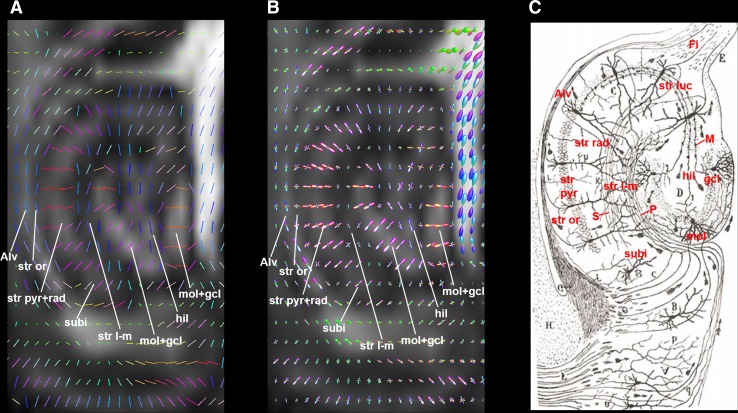
Fig. 4.
DTI principal direction (A) and CSD FODs (B) maps of tree shrew hippocampal formation. For comparison, the rodent hippocampal anatomy and connectivity depicted by Cajal [46], based on the silver staining method, is shown in C. The background images in A and B are fractional anisotropy maps. The color coding scheme in these maps are the same as that used for DEC-DTI maps. Alv alveus, CSD constrained spherical deconvolution, Fi fimbria of hippocampal formation, FODs fiber orientation distributions, gcl granule cell layer of dentate gyrus, hil hilar region of the dentate gyrus, M mossy fibers, mol molecular layer of the dentate gyrus, P performant pathway axons, S Schaffer collateral axons, str l-m stratum lacunosum-moleculare; str luc stratum lucidum of CA3, str or stratum oriens, str pyr stratum pyramidale, str rad stratum radiatum, subi subiculum.

