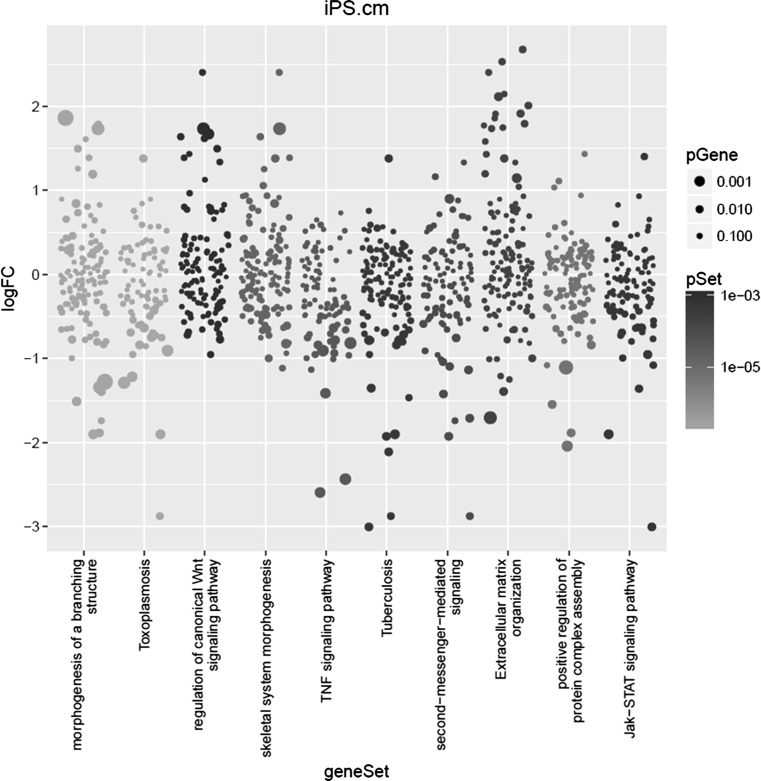
Fig. 5.
Visualization of the most significant pathways as returned by the SetRank algorithm. Each column represents a pathway. Each dot represents a gene. The size of a dot reflects its significance. The colour of a dot reflects the corrected p-value of the entire pathway. The position on the vertical axis represents the log-fold change value

