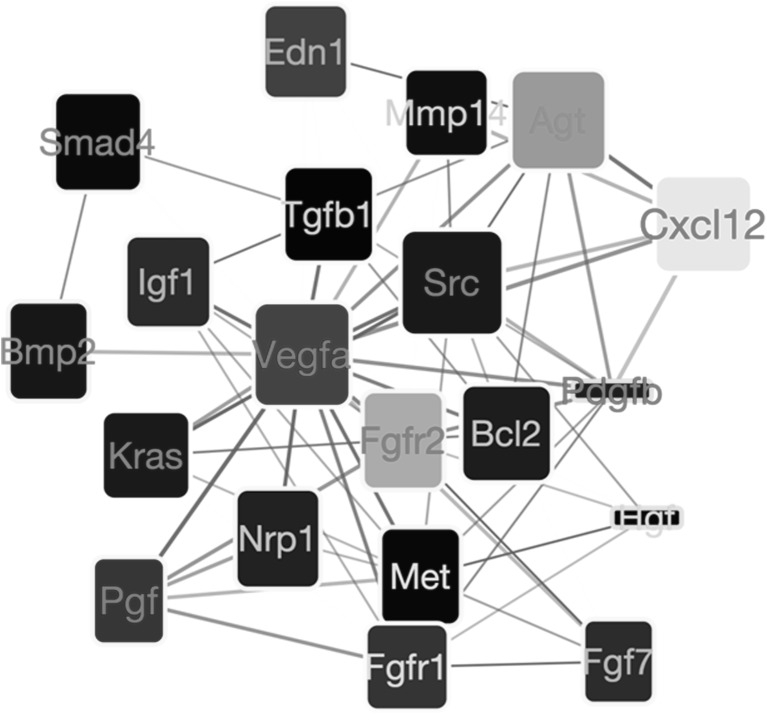
Fig. 6.
Network showing the most important gene interactions for the “morphogenesis of a branching structure” pathway (GO term GO:0001763). Interactions are retrieved from the STRING database [34]. The fill color of each node reflects the log-fold change of a gene in our microarray experiment with yellow to red indicating up-regulation and blue to cyan indicating down-regulation. The width of a node reflects the betweenness centrality of that node in the entire interactome; the height of a node reflects the betweenness only within this pathway. The node label color indicates how high the gene was ranked in the differential gene expression analysis, going from black to red with increasing significance. Thickness of an edge reflects the evidence strength for an interaction as reported by the STRING database

