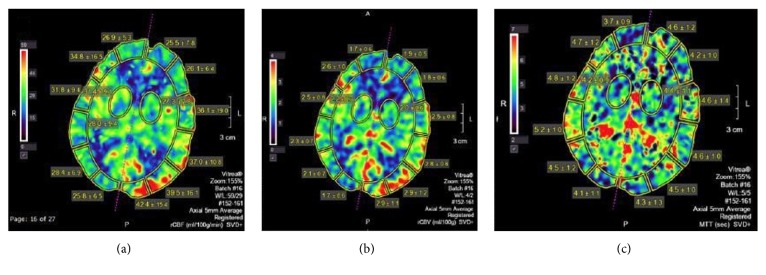
Figure 2.
CT perfusion was performed 10 days after the initial MRI imaging. The postprocessed CT perfusion maps in axial plane at the level of the left parietooccipital cortical abnormality reveal increased cerebral blood flow (CBF) and cerebral blood volume (CBV) in the affected cortex on the left as compared to the normal brain parenchyma on the right. The time to peak (TTP) is decreased.

