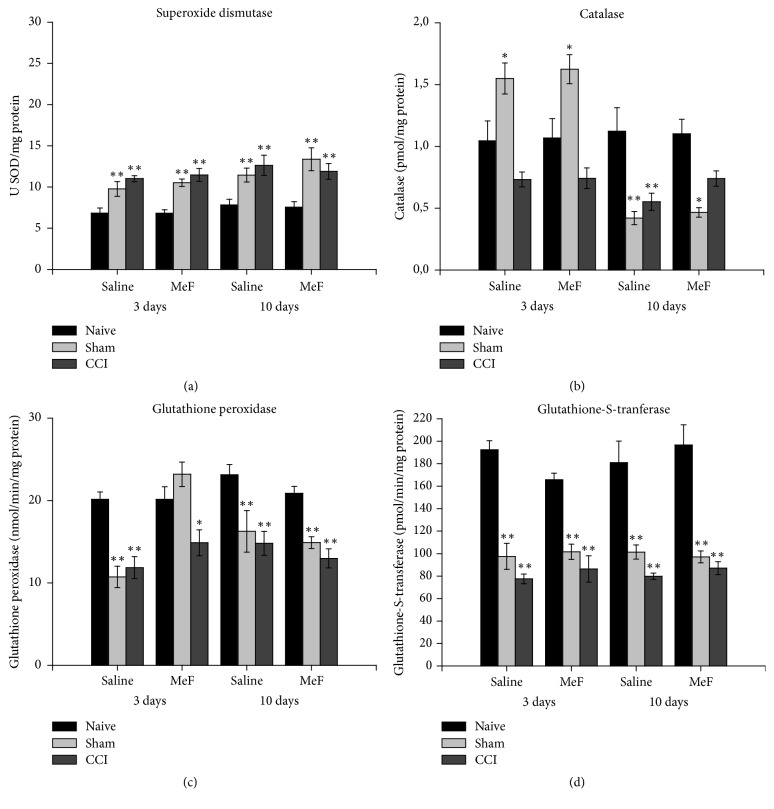
Figure 2.
Activities of (a) superoxide dismutase, (b) catalase, (c) glutathione peroxidase, and (d) glutathione-S-tranferase in spinal cord of rats treated with methanol fraction (MeF) (20 mg/kg/d) or saline for 3 and 10 days. Data represent mean ± SEM (n = 6/group). ∗ indicates a significant difference compared to naive and Sham or naive and CCI at same treatment and experimental period. ∗∗ indicates a significant difference compared to naive at same treatment and experimental period (P < 0.05; three-way ANOVA followed by Holm-Sidak post hoc test).

