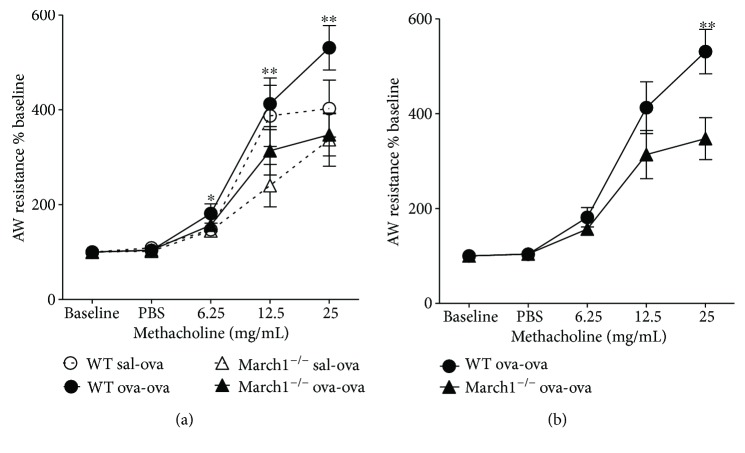
Figure 8.
March1 enhances airway hyperreactivity in lungs of OVA-sensitized and challenged mice in the ovalbumin-allergic model. Mice underwent methacholine challenge by administration of gradual 3 doses of methacholine intranasally while they are under mechanical ventilation and airway resistance in WT and March1−/− were recorded, extrapolated, and plotted (a). Airway resistance as % base for ova-ova groups in WT and March1−/− was also plotted separately (b). Dotted line in (a) represents sal-ova and solid line represents ova-ova. ∗ and ∗∗ in (a) denote statistically significant for strain factor by 2-way ANOVA at each dose. In (b), ∗∗ denotes significant difference between ova-ova WT versus ova-ova KO at 25 mg/mL dose of methacholine. Data are pooled from 5 independent experiments and presented as means with SEM; n = 8-9/group. Further details on statistical analysis are laid out in the text.

