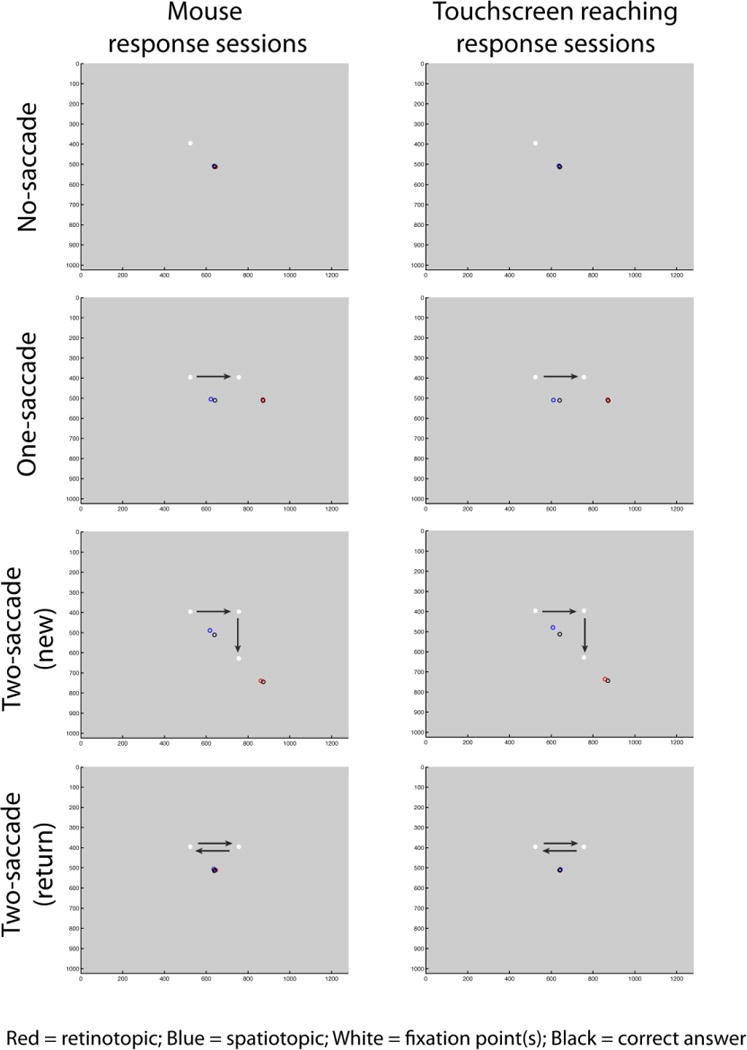
Figure 3.

Average response locations (aligned across fixations) plotted by saccade condition (rows), memory task (retinotopic vs. spatiotopic sessions; indicated by red and blue circles), and response type (mouse vs. touchscreen response sessions; columns). All trials of a given condition were aligned to the example fixation locations and saccade directions shown. We collapsed across horizontal and vertical 1-saccade conditions in this plot and in our main analyses. Arrows indicate saccade direction and were not actually presented on the screen.
