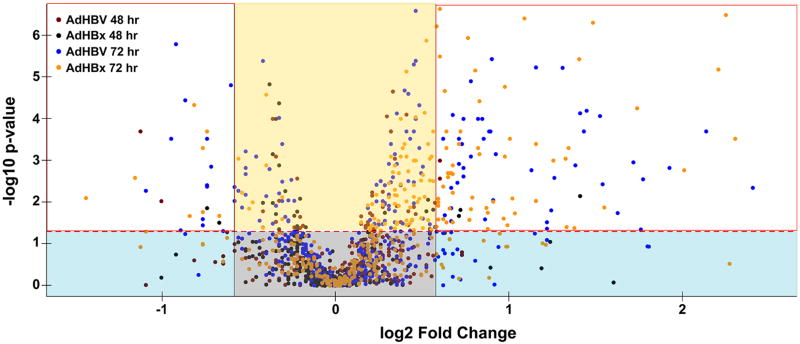
Fig 5. HBV induces low magnitude, but significant metabolic changes.
A volcano plot was used to depict the fold change (x-axis) of all metabolites between AdHBV- or AdHBx-infected and AdGFP-infected PRHs compared to the corresponding statistical significance of the alteration (y-axis). The horizontal, red dashed line corresponds with the threshold for significance (p < 0.05), with fold changes above the line being statistically significant and those below the line having a p-value > 0.05. Metabolites within the grey box have a low fold change that is not significant, and are considered unchanged. Metabolites in the blue boxes have higher fold changes but are considered not significant. Metabolites in the yellow box have significant, but low magnitude fold changes. The metabolites in the white boxes represent those exhibiting a statistically significant change ≥ 1.5 fold.

