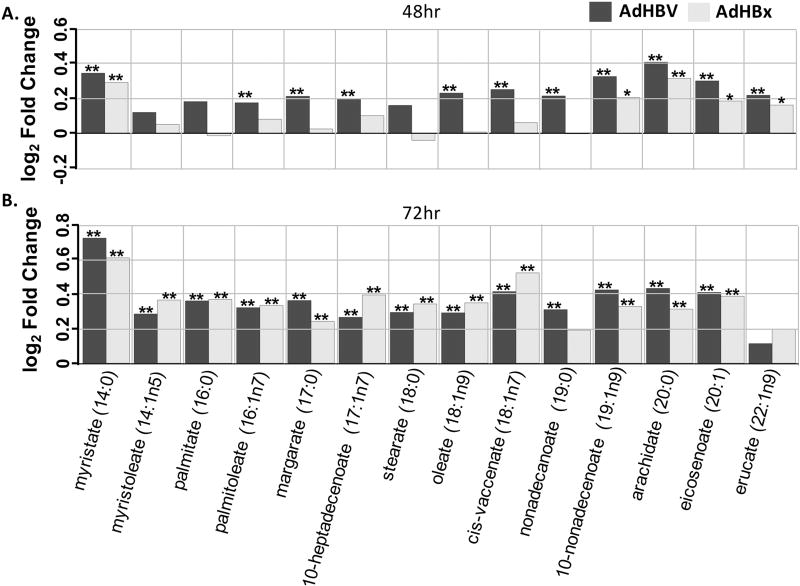
Fig 7. Metabolite changes in the long chain fatty acid sub-pathway.
A. Fold changes for indicated metabolites within the long chain fatty acid sub-pathway when comparing AdHBV-infected (black bars) or AdHBx-infected (grey bars) PRHs to AdGFP-infected PRHs at 48 hrs are shown. Significance of the difference of the mean metabolite levels between groups, determined by ANOVA, is indicated above the bar (p ≤ 0.05 = **) along with values approaching significance (0.05 ≤ p ≤ 0.01 = *). B. Data presented as in A., but for the 72 hr time point.

