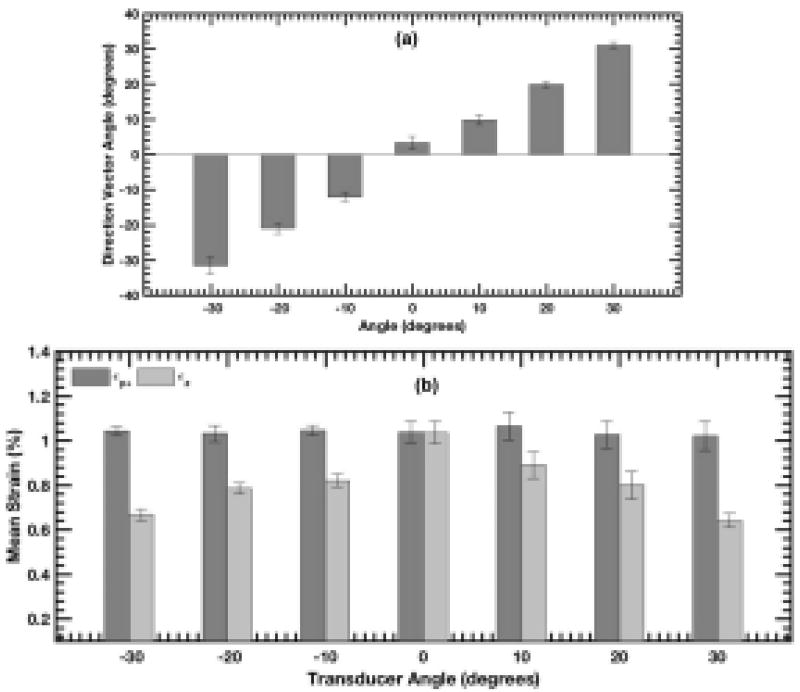
Fig. 6.
The bar plot displays the mean of (a) principal strain direction vectors and (b) strain in principal and axial strain elastograms, as a function of transducer angle. The mean in bar plots (a) and (b) is computed over the rectangular region of interests (ROIs) shown in Fig. 3 (c), and the error bars correspond to ±1 std. dev.

