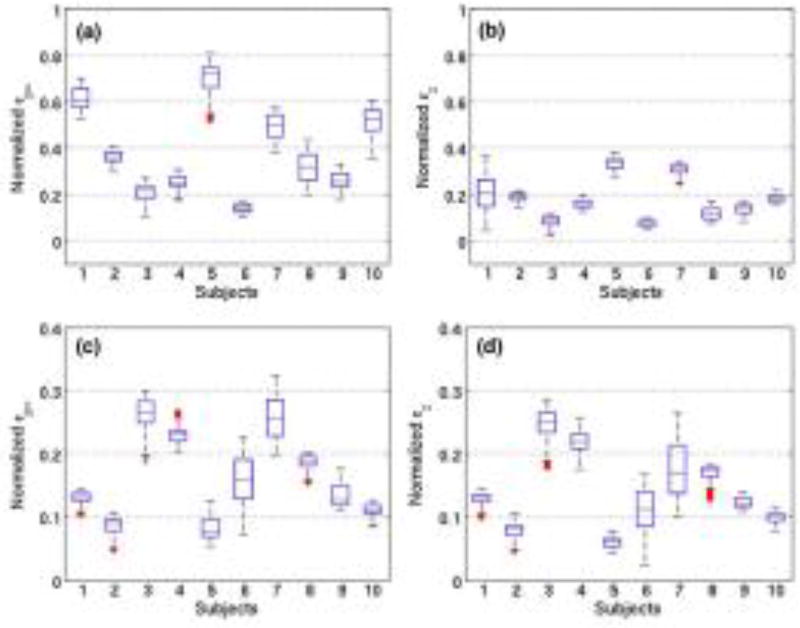
Fig. 8.
The box and whisker plots of principal (a,c) and axial strain (b,d) elastograms of 20 healthy volunteers in the age group 50–60 years. Plots (a,b) and (c,d) correspond to strains associated with volunteers with carotid artery non-parallel and parallel to the transducer, respectively. On each box, the central mark indicates the median, and the bottom and top edges of the box indicate the 25th and 75th percentiles, respectively. A representative sonogram and elastogram for each configuration is displayed in Fig. 7.

