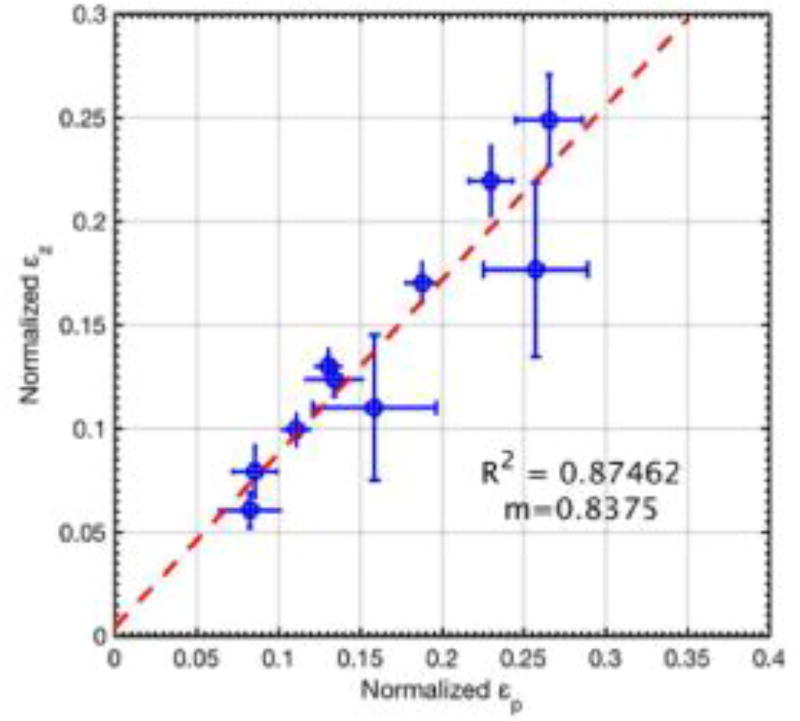
Fig. 9.
Scatter plots of axial and principal strains estimates displayed in Fig. 8. The scatter plot displays mean strain associated with subjects with straight vessels, with error-bars denoting ± 1 standard deviation. The line of least-square fit is displayed in red, and its corresponding coefficient of linear regression and slope is reported as R2 and m, respectively.

