
Figure 10.
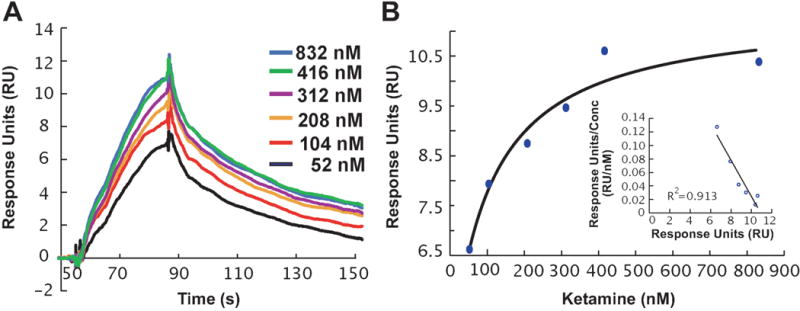
(A) SPR sensorgrams showing the dose-dependent binding of ketamine (52 – 823 nM) to ERα, as indicated by relative response units (RUs) after background subtraction. (B) Plot of RUmax versus ketamine concentration. Inset, Scatchard plot of ketamine binding.