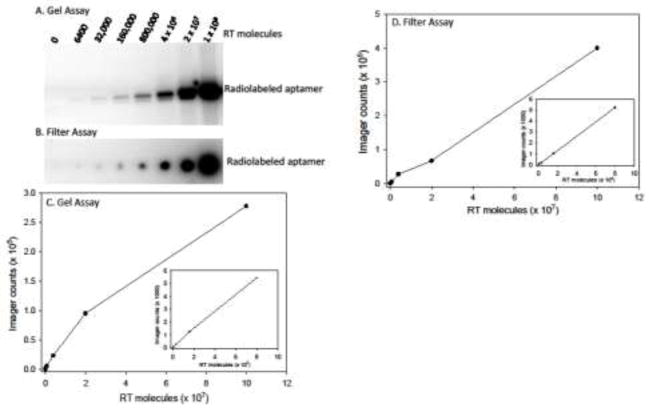
Figure 2.
Sensitivity and range of HIV-1 RT detection in the Aptamer-based RT Detection Assay. Examples of a Gel-based (A) and Filter-based (B) detection assays are shown. The results for the Gel-based (C) and Filter-based (D) assays were plotted. The inserted graphs show an expanded view of the lower RT molecule data points. Imager counts are in arbitrary units that are dependent on the exposure time and the area selected for evaluation and cannot be directly compared between the gel and filter assays. See Materials and Methods and Fig. 1 for experimental details.

