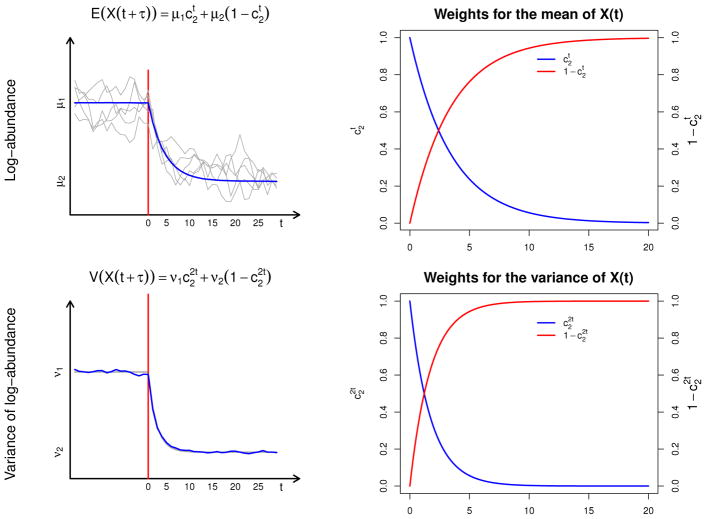
Figure 3.
The theoretical and empirical means and variances of the breakpoint Stochastic Gompertz model. In the upper left and lower left panels, the theoretical mean and variance (grey) of the breakpoint process is depicted. Overlaid in the upper panel are 5 simulated trajectories and in blue is the empirical average of 10000 simulated trajectories. The empirical average of the variances of the same 10000 trajectories is depicted in blue in the lower left panel. As stated in the results, both the mean and the variance of the process after a change are a weighted average of the stationary means and variances before and after the change. The upper and lower right panels show how the weights in these weighted averages depend on the strength of density-dependence after the change (See result 1). In particular, as stated in Result 4.3, note that the weights of the variance change twice as fast as the changes in the mean (see for instance [36])

