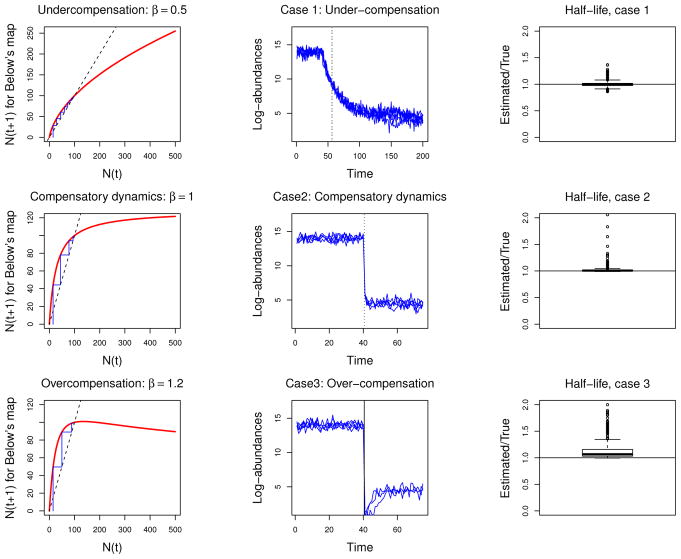
Figure 4.
Testing the robustness of the breakpoint Stochastic Gompertz model. A biologically realistic change-point stochastic process was used to test the robustness of the Gompertz model to unaccounted biological complexities. Accordingly, for three different types of compensatory dynamics, 1000 simulations from a population growth model with demographic variability, demographic noise, sampling error and a change-point were used to estimate the parameters of the BPSG model with added sampling error, along with the half life of the change. In the figure, each row, from left to right, shows the type of compensatory dynamics used in the simulations (left panels), 10 samples of the simulated time series of length 200 with the true half life t̄ (center panels and solid vertical line) and the estimated half life (dotted vertical line), and a box plot of the 1000 half life estimates (right panels). For the compensatory and over compensatory dynamics, only the first 75 time steps of the simulated time series are shown for clarity. All the boxplots are standard. The midline is the median of the data, with the upper and lower limits of the box being the third and first quartile (75th and 25th percentile) respectively. The whiskers extend up to 1.5 times the interquartile range from the top (bottom) of the box to the furthest datum within that distance. The data points beyond that distance are represented individually as points.

