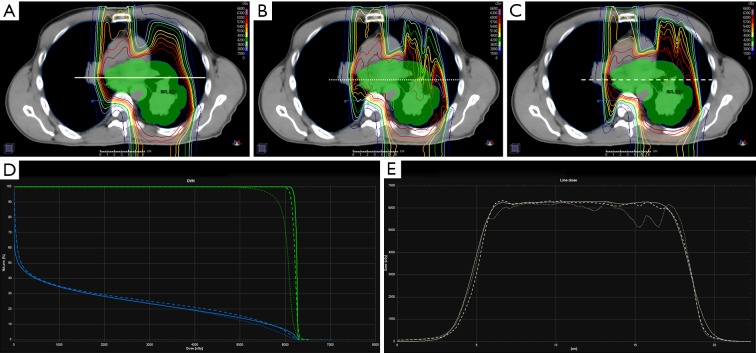
Figure 1.
Stage III non-small cell lung cancer patient planned for proton pencil beam scanning therapy using three techniques: clinically approved analytical pencil beam (PB) optimization and calculation (A), PB optimization and Monte Carlo (MC) re-calculation (B), MC optimization and calculation (C). The upper row shows the dose distributions (rainbow isodose lines) for each planning technique overlaid on the planning CT and clinical target volume (CTV, green-filled contour). The bottom row shows the DVH for CTV (green) and lung (blue) (D) and line dose profiles (E) for each of the three techniques (solid line: PB opt + calc, dotted line: PB opt + MC calc, dashed line: MC opt + calc). DVH, dose-volume histogram; opt, optimized; calc, recalculated.

