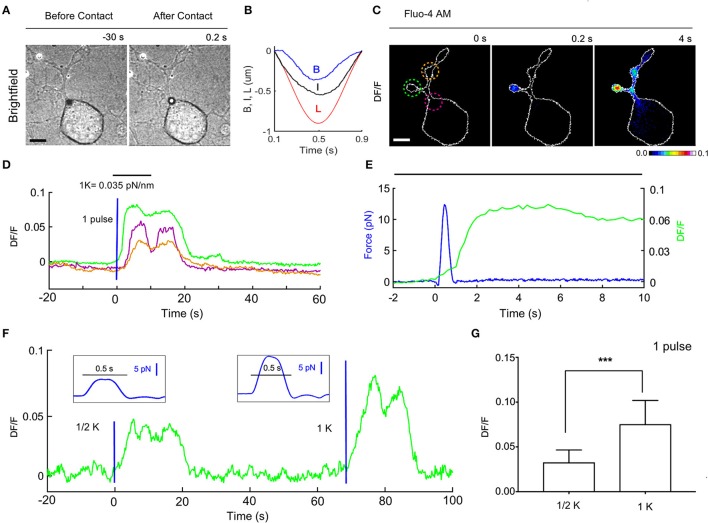
Figure 5.
Ca2+ transients evoked by calibrated mechanical stimulations in NG10-15 cells. (A) Trapped bead above the cell, before (left) and after (right) contact with cell, scale bar: 10 μm. (B) Time course of the trap (L) and bead (B) measured displacements and calculated indentation I. (C) Fluorescence change, DF/F images, with 3 different ROIs to determine the fluorescence change vs. time (D). (E) Detail of the time course of the applied force (blue) and the evoked calcium transient corresponding to green ROI. (F) Time course of evoked calcium transient (green) for an experiment in which a weak stimulus was first applied (trap stiffness, k/2), followed by a stronger stimulus (trap stiffness, k). The blue lines indicate application of the force pulses represented in inlets. (G) Statistics for the maximum of DF/F (mean ± SD) for k/2 (mean 0.0326 ± 0.004, n = 10) and k (0.075 ± 0.008, n = 12). t-test: ***P ≤ 0.001.

