Figure 6.
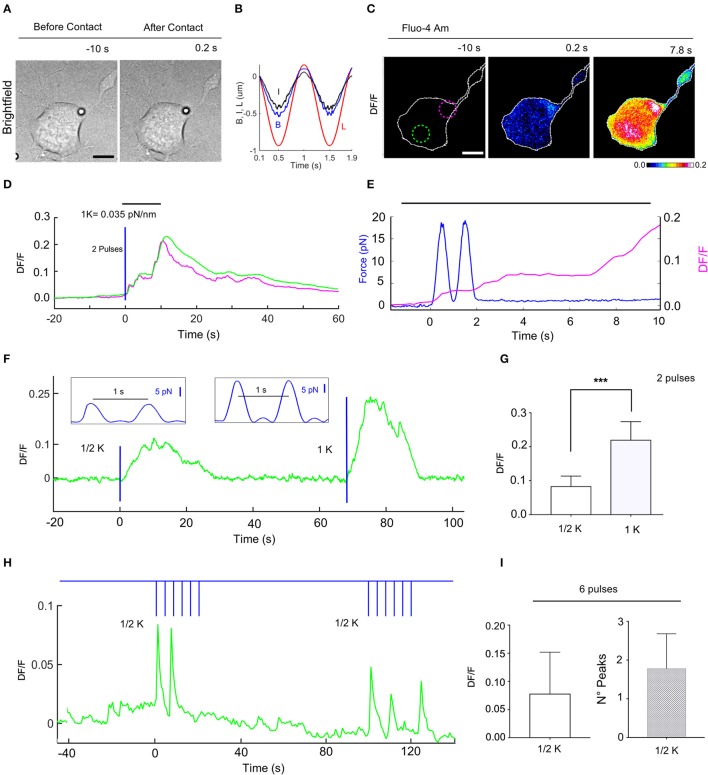
Calcium transients evoked by repetitive mechanical stimulations of NG108-15 cells. (A) Trapped bead above the cell, before (left) and after contact with cell (right), scale bar: 10 μm. (B) Time course of the trap (L) and bead (B) measured displacements and calculated indentation I for two pulses. (C) Fluorescence change, DF/F images, with 2 different ROIs to determine the fluorescence change vs. time (D). (E) Time course of the applied force (blue trace) and the evoked calcium transient (magenta) from ROI. (F) Time course of evoked calcium transient (green) for an experiment in which a two pulses stimulus was first applied (trap stiffness, k/2), followed by a second two pulses stimulus (trap stiffness, k = 0.035 pN/nm). The blue lines indicate application of the stimuli with the force pulses represented in inlets. (G) Statistics for the maximum of DF/F values for k/2 (0.083 ± 0.011, n = 8) and k (0.22 ± 0.018, n = 9). T-test: ***P ≤ 0.001. (H) Time course of the evoked DF/F (green) and the mechanical stimulation (blue) composed of two train of 6 pulses at 0.25 Hz with k/2. (I) Statistics bar graph representing the mean value of DF/F induced by 6 pulses with k/2 (left, 0.078 ± 0.02, n = 13) and the mean value of the number of calcium peaks for each train of 6 pulses (right, 1.8 ± 0.2, n = 14).

