
Figure 3.
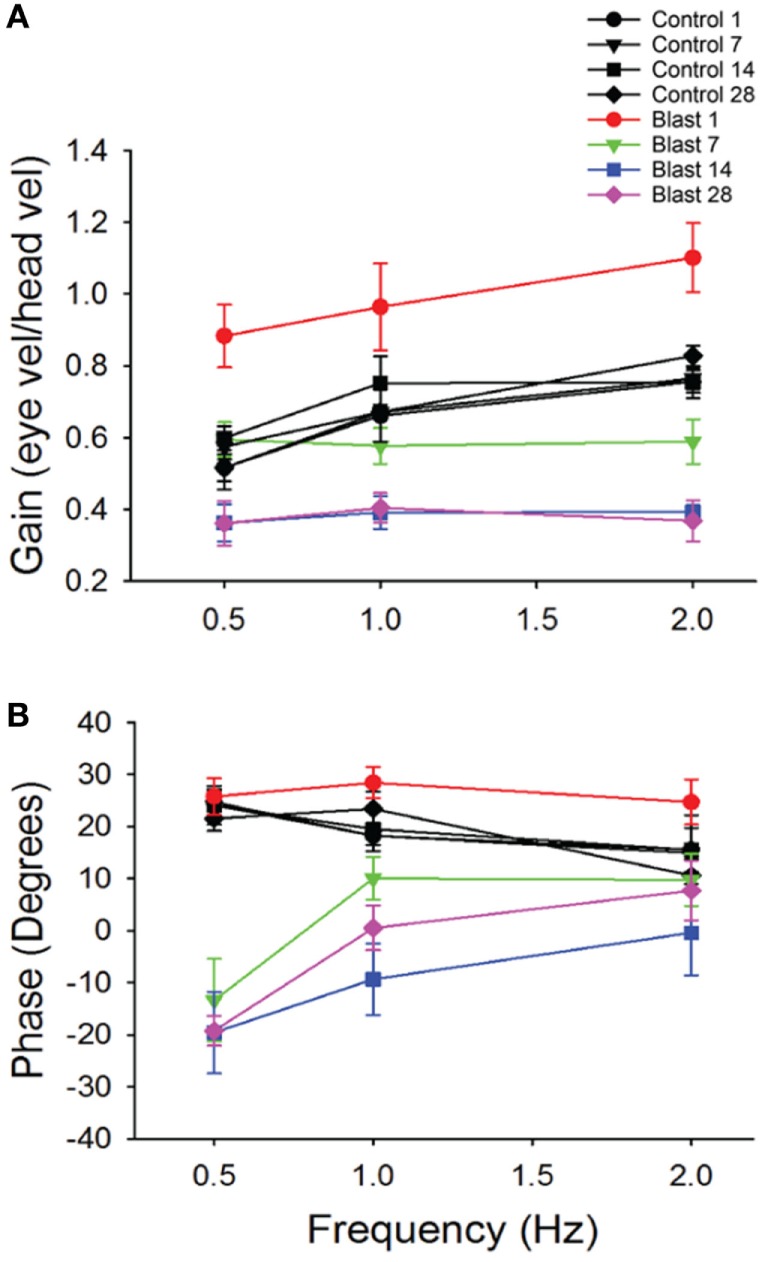
Vestibuloocular reflex (VOR) responses. Mean horizontal VOR responses for control (black, n = 10) and blast (colors, n = 10) animals on days 1, 7, 14, and 28 post-blast exposure as a function of rotation frequency. Mean horizontal vestibuloocular reflex gain (A) and phase (B) values for 0.5, 1.0, and 2.0 Hz (20°/s peak velocity). Error bars = SE.