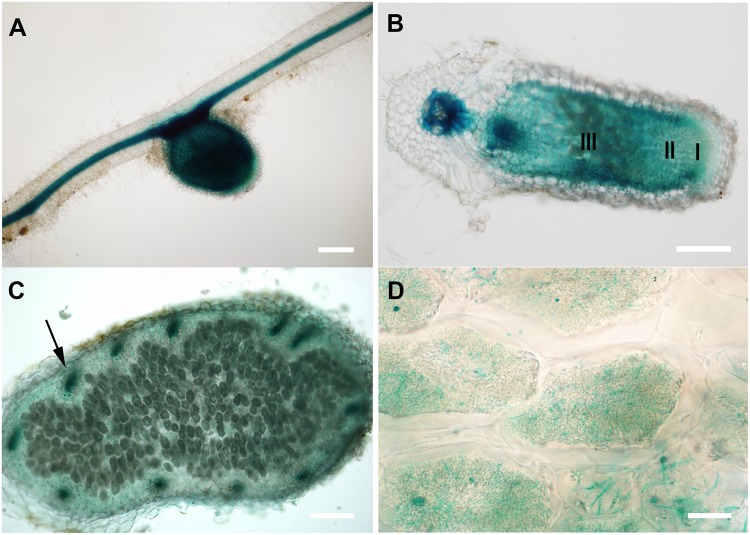
FIGURE 1.
GUS staining of transgenic M. truncatula expressing MtCAS31pro:GUS. (A) Nodule and root; bar = 200 μm. (B) Longitudinal section of nodules, I represents the meristematic zone, II represents the infection zone, III represents the nitrogen fixation zone; bar = 200 μm. (C) Cross section of the nitrogen fixation zone of nodule; bar = 100 μm. Arrow represents the vascular bundle in nodules. (D) Magnified nodule cells in C; bar = 10 μm.

