FIGURE 4.
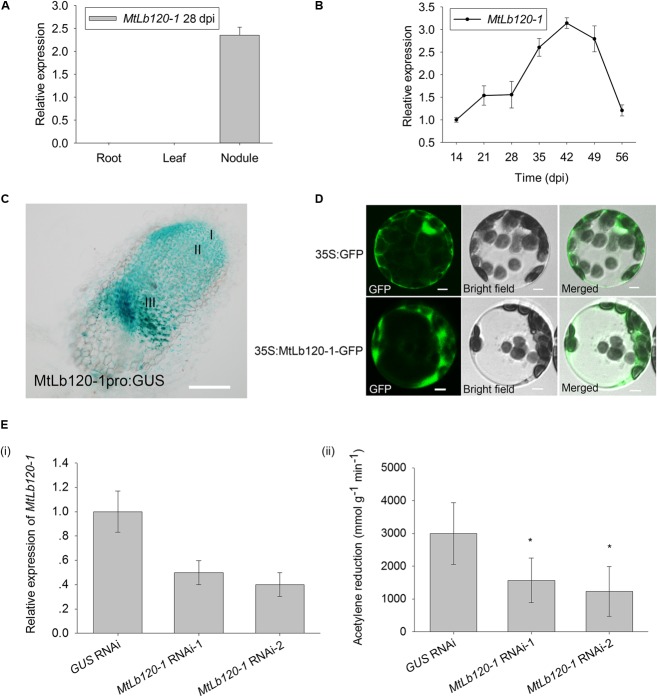
Expression pattern of MtLb120-1. (A) Relative expression of MtLb120-1 in different tissues of M. truncatula at 28 dpi. Values were normalized to ACTIN expression. The data represent the mean ± SD of three technical replicates. (B) Relative expression of MtLb120-1 in nodules at different inoculation time points. M. truncatula was inoculated with S. meliloti 1021. Nodules at different inoculation time points were used for analysis. Values were normalized to ACTIN expression. The data represent the mean ± SD of three technical replicates. (C) Histochemical GUS staining of nodules in M. truncatula expressing MtLb120-1pro:GUS by hairy root transformation; bar = 100 μm. (D) Subcellular localization of MtLb120-1. MtLb120-1 fused with GFP driven by the CaMV35S promoter was transformed into Arabidopsis protoplasts. The fluorescence was detected by confocal laser scanning microscopy at 488 nm excitation. GFP driven by the CaMV35S promoter is used as a control; bar = 5 μm. (E) Nitrogenase activity of MtLb120-1 RNAi lines. (i) The relative expression level of MtLb120-1 in MtLb120-1 RNAi lines. (ii) Acetylene reduction represents nitrogenase activity MtLb120-1 RNAi lines. GUS RNAi is used as the control. Data represent the mean ± SD of three replications with 15 plants each. ∗P ≤ 0.05, Student’s t-test.

