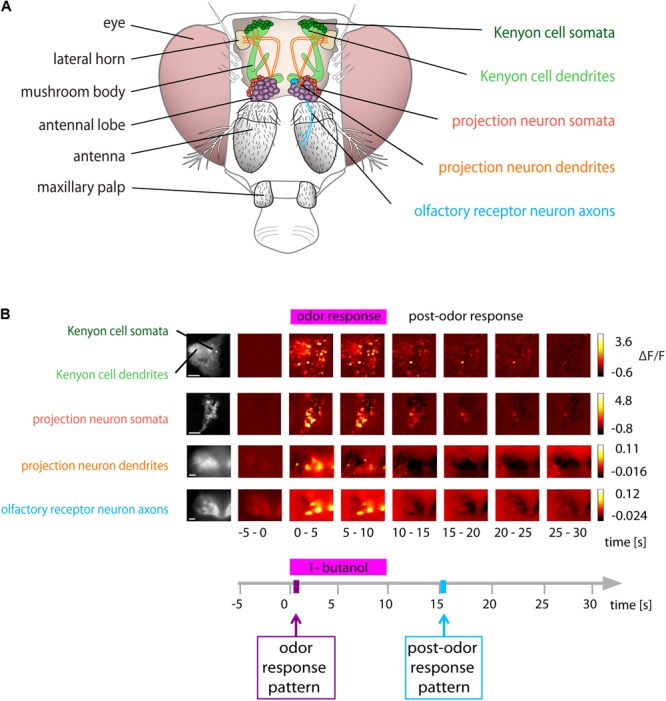
FIGURE 1.

Odor and post-odor responses along the olfactory pathway. (A) Schematic of the olfactory system of Drosophila. (Left): gross anatomy. (Right): areas investigated in this study. (B) Spatial distribution of Ca2+ activity during and after olfactory stimulation (here with 1-butanol) in the neuronal compartments along the olfactory pathway. Color coded ΔF/F images show the average of 5 s recording time (i.e., 25 frames). All areas showed distinct responses upon odorant stimulation. (Scale bars 20 μm). See also calcium imaging movies on http://neuro.uni-konstanz.de/luedke/.
